Statistical variability
{{Short description|Statistical property quantifying how much a collection of data is spread out}} {{refimprove|date=December 2010}} [[File:Comparison standard deviations.svg|thumb|400px|right|Example of samples from two populations with the same mean but different dispersion. The blue population is much more dispersed than the red population.]]
In [[statistics]], '''dispersion''' (also called '''variability''', '''scatter''', or '''spread''') is the extent to which a [[Probability distribution|distribution]] is stretched or squeezed.{{cite web|last1=NIST/SEMATECH e-Handbook of Statistical Methods|title=1.3.6.4. Location and Scale Parameters|url=http://www.itl.nist.gov/div898/handbook/eda/section3/eda364.htm|website=www.itl.nist.gov|publisher=U.S. Department of Commerce}} Common examples of measures of statistical dispersion are the [[variance]], [[standard deviation]], and [[interquartile range]]. For instance, when the variance of data in a set is large, the data is widely scattered. On the other hand, when the variance is small, the data in the set is clustered.
Dispersion is contrasted with location or [[central tendency]], and together they are the most used properties of distributions.
==Measures of statistical dispersion== A '''measure of statistical dispersion''' is a nonnegative [[real number]] that is zero if all the data are the same and increases as the data become more diverse.
Most measures of dispersion have the same [[units of measurement|unit]]s as the [[quantity]] being measured. In other words, if the measurements are in metres or seconds, so is the measure of dispersion. Examples of dispersion measures include:
- [[Standard deviation]]
- [[Interquartile range]] (IQR)
- [[Range (statistics)|Range]]
- [[Mean absolute difference]] (also known as Gini mean absolute difference)
- [[Median absolute deviation]] (MAD)
- [[Average absolute deviation]] (or simply called average deviation)
- [[Distance standard deviation]] These are frequently used (together with [[scale factor]]s) as [[estimator]]s of [[scale parameter]]s, in which capacity they are called '''estimates of scale.''' [[Robust measures of scale]] are those unaffected by a small number of [[outliers]], and include the IQR and MAD.
All the above measures of statistical dispersion have the useful property that they are ''location-invariant'' and ''linear in scale''. This means that if a [[random variable]] X has a dispersion of S_X then a [[linear transformation]] Y=aX+b for [[real number|real]] a and b should have dispersion S_Y=|a|S_X, where |a| is the [[absolute value]] of a, that is, ignores a preceding negative sign -.
Other measures of dispersion are '''[[dimensionless]]'''. In other words, they have no units even if the variable itself has units. These include:
- [[Coefficient of variation]]
- [[Quartile coefficient of dispersion]]
- [[Relative mean difference]], equal to twice the [[Gini coefficient]]
- [[Entropy (information theory)|Entropy]]: While the entropy of a discrete variable is location-invariant and scale-independent, and therefore not a measure of dispersion in the above sense, the entropy of a continuous variable is location invariant and additive in scale: If H(z) is the entropy of a continuous variable z and z=ax+b, then H(z)=H(x)+\log(a).
There are other measures of dispersion:
- [[Variance]] (the square of the standard deviation) – location-invariant but not linear in scale.
- [[Variance-to-mean ratio]] – mostly used for [[count data]] when the term [[coefficient of dispersion]] is used and when this ratio is [[dimensionless]], as count data are themselves dimensionless, not otherwise.
Some measures of dispersion have specialized purposes. The [[Allan variance]] can be used for applications where the noise disrupts convergence.{{Cite web|title=Allan Variance -- Overview by David W. Allan|url=http://www.allanstime.com/AllanVariance/|access-date=2021-09-16|website=www.allanstime.com}} The [[Hadamard variance]] can be used to counteract linear frequency drift sensitivity.{{Cite web|title=Hadamard Variance|url=http://www.wriley.com/paper4ht.htm|access-date=2021-09-16|website=www.wriley.com}}
For [[categorical variable]]s, it is less common to measure dispersion by a single number; see [[qualitative variation]]. One measure that does so is the discrete [[information entropy|entropy]].
==Sources== In the [[physical sciences]], such variability may result from random measurement errors: instrument measurements are often not perfectly [[accuracy and precision|precise, i.e., reproducible]], and there is additional [[inter-rater variability]] in interpreting and reporting the measured results. One may assume that the quantity being measured is stable, and that the variation between measurements is due to [[observational error]]. A system of a large number of particles is characterized by the mean values of a relatively few number of macroscopic quantities such as temperature, energy, and density. The standard deviation is an important measure in fluctuation theory, which explains many physical phenomena, including why the sky is blue.{{cite book|last=McQuarrie|first=Donald A.|title=Statistical Mechanics|year=1976|publisher=Harper & Row|location=NY|isbn=0-06-044366-9}}
In the [[biological sciences]], the quantity being measured is seldom unchanging and stable, and the variation observed might additionally be ''intrinsic'' to the phenomenon: It may be due to ''inter-individual variability'', that is, distinct members of a population differing from each other. Also, it may be due to '''''intra-individual variability''''', that is, one and the same subject differing in tests taken at different times or in other differing conditions. Such types of variability are also seen in the arena of manufactured products; even there, the meticulous scientist finds variation.
==A partial ordering of dispersion==
A [[mean-preserving spread]] (MPS) is a change from one probability distribution A to another probability distribution B, where B is formed by spreading out one or more portions of A's probability density function while leaving the mean (the expected value) unchanged.{{cite journal |last=Rothschild |first=Michael |last2=Stiglitz |first2=Joseph |title=Increasing risk I: A definition |journal=[[Journal of Economic Theory]] |year=1970 |volume=2 |issue=3 |pages=225–243 |doi=10.1016/0022-0531(70)90038-4 }} The concept of a mean-preserving spread provides a [[partial ordering]] of probability distributions according to their dispersions: of two probability distributions, one may be ranked as having more dispersion than the other, or alternatively neither may be ranked as having more dispersion.
==See also== {{commonscat|Dispersion (statistics)}} *[[Average]] *[[Circular dispersion]] *[[Dispersion matrix]] *[[Probability density function]] *[[Qualitative variation]] *[[Measurement uncertainty]] *[[Precision (statistics)]] *[[Robust measures of scale]] *[[Summary statistics]]
==References== {{reflist}}
{{Statistics|descriptive}}
{{DEFAULTSORT:Statistical Dispersion}} [[Category:Statistical deviation and dispersion]] [[Category:Summary statistics]] [[Category:Accuracy and precision]]
From MOAI Insights

디지털 트윈, 당신 공장엔 이미 있다 — 엑셀과 MES 사이 어딘가에
디지털 트윈은 10억짜리 3D 시뮬레이션이 아니다. 지금 쓰고 있는 엑셀에 좋은 질문 하나를 더하는 것 — 두 전문가가 중소 제조기업이 이미 가진 데이터로 예측하는 공장을 만드는 현실적 로드맵을 제시한다.
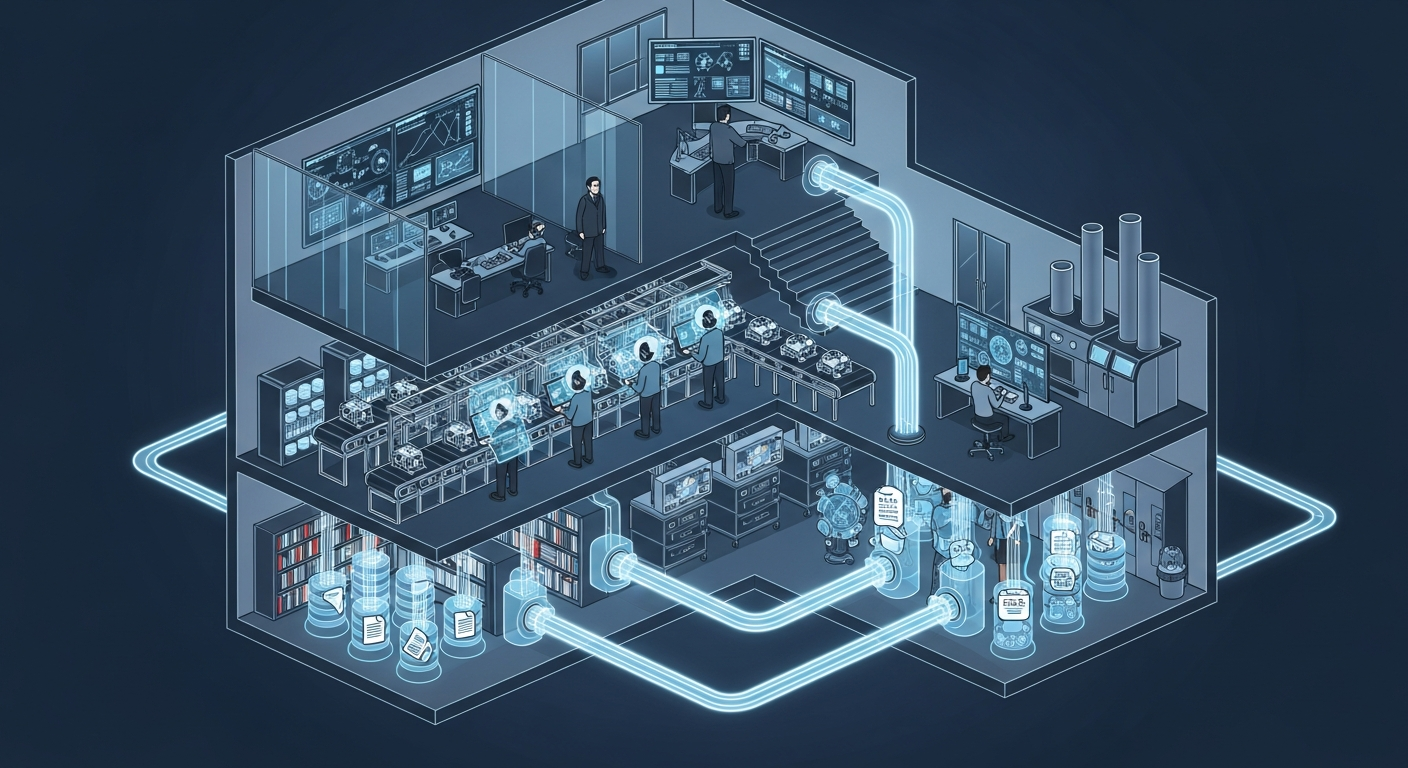
공장의 뇌는 어떻게 생겼는가 — 제조운영 AI 아키텍처 해부
지식관리, 업무자동화, 의사결정지원 — 따로 보면 다 있던 것들입니다. 제조 AI의 진짜 차이는 이 셋이 순환하면서 '우리 공장만의 지능'을 만든다는 데 있습니다.
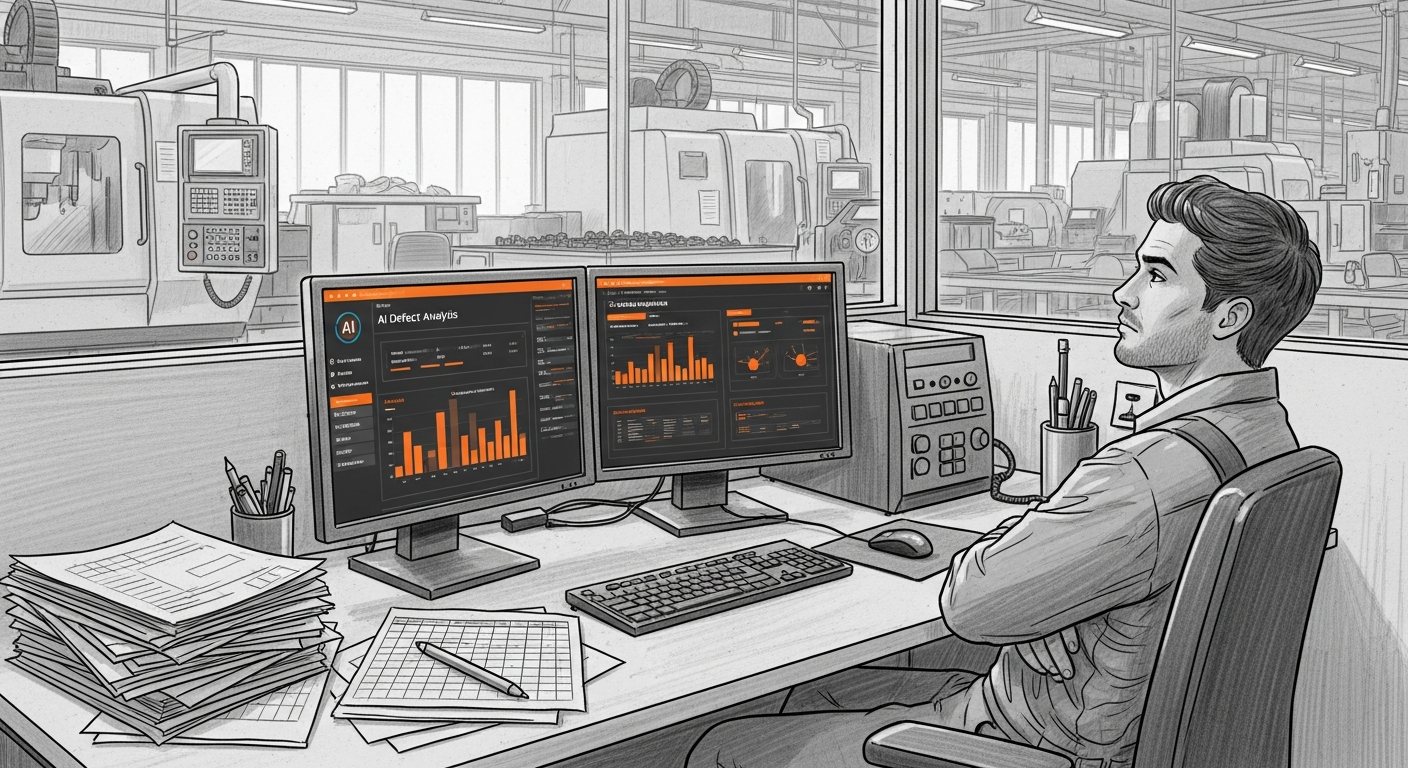
그 30분을 18년 동안 매일 반복했습니다 — 품질팀장이 본 AI Agent
18년차 품질팀장이 매일 아침 30분씩 반복하던 데이터 분석을 AI Agent가 3분 만에 해냈습니다. 챗봇과는 완전히 다른 물건 — 직접 시스템에 접근해서 데이터를 꺼내고 분석하는 AI의 현장 도입기.
Want to apply this in your factory?
MOAI helps manufacturing companies adopt AI tailored to their operations.
Talk to us →