Frequency domain
{{Short description|Signal representation}} [[File:Fourier transform time and frequency domains (small).gif|frame|right|The [[Fourier transform]] converts the function's time-domain representation, shown in red, to the function's frequency-domain representation, shown in blue. The component frequencies, spread across the frequency spectrum, are represented as peaks in the frequency domain.]]
In [[mathematics]], [[physics]], [[electronics]], [[control systems engineering]], and [[statistics]], the '''frequency domain''' refers to the analysis of [[mathematical function]]s or [[Signal (information theory)|signals]] with respect to [[frequency]] (and possibly phase), rather than time, as in [[time series]].{{cite book |last1=Broughton |first1=S. A. |first2=K. |last2=Bryan|authorlink2=Karin Bryan |year=2008 |title=Discrete Fourier Analysis and Wavelets: Applications to Signal and Image Processing |location=New York |publisher=[[John Wiley & Sons|Wiley]] |page=72}} While a [[time-domain]] graph shows how a signal changes over time, a frequency-domain graph shows how the signal is distributed within different frequency bands over a range of frequencies. A complex valued frequency-domain representation consists of both the magnitude and the [[phase (waves)|phase]] of a set of [[Sine wave|sinusoids]] (or other basis waveforms) at the frequency components of the signal. Although it is common to refer to the magnitude portion (the real valued frequency-domain) as the frequency response of a signal, the phase portion is required to uniquely define the signal.
A given function or signal can be converted between the time and frequency domains with a pair of mathematical [[Operator (mathematics)|operators]] called [[Transform (mathematics)|transforms]]. An example is the [[Fourier transform]], which converts a time function into a complex valued sum or integral of [[sine wave]]s of different frequencies, with amplitudes and phases, each of which represents a frequency component. The "[[spectrum]]" of frequency components is the frequency-domain representation of the signal. The [[inverse Fourier transform]] converts the frequency-domain function back to the time-domain function. A [[spectrum analyzer]] is a tool commonly used to visualize [[signal (electrical engineering)|electronic signals]] in the frequency domain.
A frequency-domain representation may describe either a static function or a particular time period of a dynamic function (signal or system). The frequency transform of a dynamic function is performed over a finite time period of that function and assumes the function repeats infinitely outside of that time period. Some specialized signal processing techniques for dynamic functions use transforms that result in a joint [[time–frequency representation|time–frequency domain]], with the [[instantaneous frequency]] response being a key link between the time domain and the frequency domain.
==Advantages== One of the main reasons for using a frequency-domain representation of a problem is to simplify the mathematical analysis. For mathematical systems governed by [[linear differential equation]]s, a very important class of systems with many real-world applications, converting the description of the system from the time domain to a frequency domain converts the [[differential equation]]s to [[algebraic equation]]s, which are much easier to solve.
In addition, looking at a system from the point of view of frequency can often give an intuitive understanding of the qualitative behavior of the system, and a revealing scientific nomenclature has grown up to describe it, characterizing the behavior of physical systems to time varying inputs using terms such as [[Bandwidth (signal processing)|bandwidth]], [[frequency response]], [[Gain (electronics)|gain]], [[phase (waves)|phase shift]], [[resonant frequency|resonant frequencies]], [[time constant]], [[resonance width]], [[damping factor]], [[Q factor]], [[harmonic]]s, [[spectrum]], [[power spectral density]], [[eigenvalue]]s, [[pole (complex analysis)|poles]], and [[zero (complex analysis)|zeros]].
An example of a field in which frequency-domain analysis gives a better understanding than time domain is [[music]]; the theory of operation of musical instruments and the [[musical notation]] used to record and discuss pieces of music is implicitly based on the breaking down of complex sounds into their separate component frequencies ([[musical note]]s).
==Magnitude and phase==
In using the [[Laplace transform|Laplace]], [[Z-transform|Z-]], or Fourier transforms, a signal is described by a [[complex function]] of frequency: the component of the signal at any given frequency is given by a [[complex number]]. The [[Complex_number#Modulus and argument|modulus]] of the number is the [[amplitude]] of that component, and the [[Complex_number#Modulus and argument|argument]] is the relative phase of the wave. For example, using the [[Fourier transform]], a [[sound wave]], such as human speech, can be broken down into its component tones of different frequencies, each represented by a sine wave of a different amplitude and phase. The response of a system, as a function of frequency, can also be described by a complex function. In many applications, phase information is not important. By discarding the phase information, it is possible to simplify the information in a frequency-domain representation to generate a [[frequency spectrum]] or [[spectral density]]. A [[spectrum analyzer]] is a device that displays the spectrum, while the time-domain signal can be seen on an [[oscilloscope]].
==Types==
Although "''the''" frequency domain is spoken of in the singular, there are a number of different mathematical transforms which are used to analyze time-domain functions and are referred to as "frequency domain" methods. These are the most common transforms, and the fields in which they are used:
- [[Fourier series]] – periodic signals, [[Oscillation|oscillating]] systems.
- [[Fourier transform]] – aperiodic signals, transients.
- [[Laplace transform]] – [[electronic circuits]] and [[control system]]s.
- [[Z transform]] – [[discrete-time]] signals, [[digital signal processing]].
- [[Wavelet transform]] — image analysis, [[data compression]]. More generally, one can speak of the '''{{visible anchor|transform domain}}''' with respect to any transform. The above transforms can be interpreted as capturing some form of frequency, and hence the transform domain is referred to as a frequency domain.
==Discrete frequency domain {{anchor|Discrete}}==
A '''discrete frequency domain''' is a frequency domain that is [[Discrete space|discrete]] rather than [[Continuum (topology)|continuous]]. For example, the [[discrete Fourier transform]] maps a function having a [[Discrete time|discrete time domain]] into one having a discrete frequency domain. The [[discrete-time Fourier transform]], on the other hand, maps functions with discrete time ([[discrete-time signal]]s) to functions that have a continuous frequency domain. {{cite book | title = DSP primer | author = C. Britton Rorabaugh | publisher = McGraw-Hill Professional | year = 1998 | isbn = 978-0-07-054004-0 | page = 153 | url = https://books.google.com/books?id=MYhMratb5gsC&pg=PA153 }} {{cite book | title = Quantitative EEG analysis methods and clinical applications | edition = | author = Shanbao Tong and Nitish Vyomesh Thakor | publisher = Artech House | year = 2009 | isbn = 978-1-59693-204-3 | page = 53 | url = https://books.google.com/books?id=joodLUTyIEYC&pg=PA53 }}
A [[periodic signal]] has energy only at a base frequency and its harmonics; thus it can be analyzed using a discrete frequency domain. A [[discrete-time signal]] gives rise to a periodic frequency spectrum. In a situation where both these conditions occur, a signal which is discrete and periodic results in a frequency spectrum which is also discrete and periodic; this is the usual context for a [[discrete Fourier transform]].
==History of term== The use of the terms "frequency domain" and "[[time domain]]" arose in communication engineering in the 1950s and early 1960s, with "frequency domain" appearing in 1953.{{citation | first = L. A. | last = Zadeh | title = Theory of Filtering | journal = Journal of the Society for Industrial and Applied Mathematics | volume = 1 | year = 1953 | pages = 35–51 | doi=10.1137/0101003}} See [[Time domain#Origin of term|time domain: origin of term]] for details.[http://jeff560.tripod.com/t.html Earliest Known Uses of Some of the Words of Mathematics (T)], Jeff Miller, March 25, 2009
==See also== {{col div|colwidth=30em}}
- [[Bandwidth (signal processing)|Bandwidth]]
- [[Blackman–Tukey transformation]]
- [[Fourier analysis]] for computing periodicity in evenly spaced data
- [[Least-squares spectral analysis]] for computing periodicity in unevenly spaced data
- [[Reciprocal space]]
- [[Short-time Fourier transform]]
- [[Time–frequency representation]]
- [[Time–frequency analysis]]
- [[Wavelet]]
- [[Wavelet transform]] – [[digital image processing]], [[signal compression]] {{colend}}
==References== {{reflist}} Goldshleger, N., Shamir, O., Basson, U., Zaady, E. (2019). Frequency Domain Electromagnetic Method (FDEM) as tool to study contamination at the sub-soil layer. Geoscience 9 (9), 382.
==Further reading== *{{cite journal |first=B. |last=Boashash |title=Note on the Use of the Wigner Distribution for Time Frequency Signal Analysis |journal=IEEE Transactions on Acoustics, Speech, and Signal Processing |volume=36 |issue=9 |pages=1518–1521 |date=Sep 1988 |doi=10.1109/29.90380|url=http://espace.library.uq.edu.au/view/UQ:209682/Boashash_1988_WVD_analytic_signal.pdf }}. *{{cite journal |first=B. |last=Boashash |title=Estimating and Interpreting the Instantaneous Frequency of a Signal-Part I: Fundamentals |journal=Proceedings of the IEEE |volume=80 |issue=4 |pages=519–538 |date=April 1992 |doi=10.1109/5.135376}}.
{{Statistics|analysis}}
{{DEFAULTSORT:Frequency Domain}} [[Category:Frequency-domain analysis]]
From MOAI Insights

디지털 트윈, 당신 공장엔 이미 있다 — 엑셀과 MES 사이 어딘가에
디지털 트윈은 10억짜리 3D 시뮬레이션이 아니다. 지금 쓰고 있는 엑셀에 좋은 질문 하나를 더하는 것 — 두 전문가가 중소 제조기업이 이미 가진 데이터로 예측하는 공장을 만드는 현실적 로드맵을 제시한다.
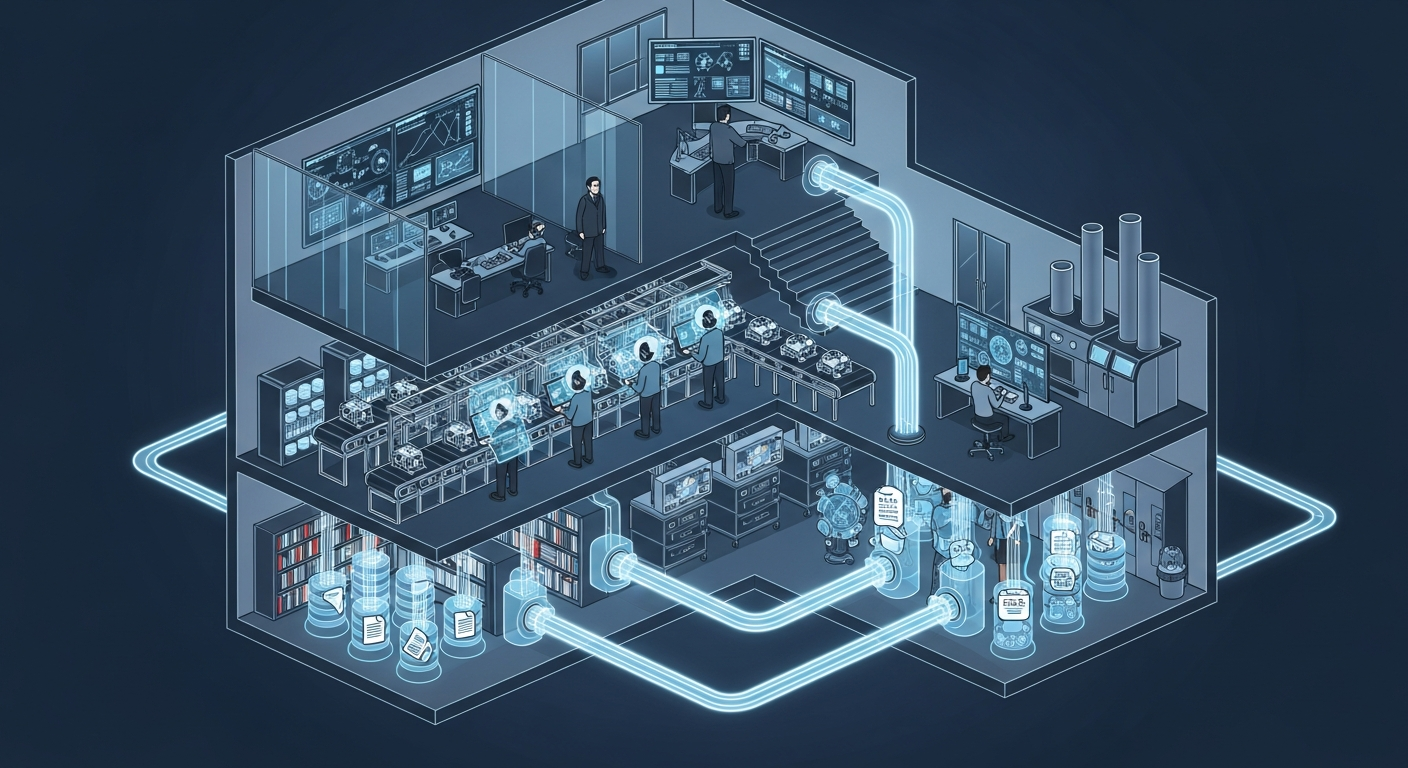
공장의 뇌는 어떻게 생겼는가 — 제조운영 AI 아키텍처 해부
지식관리, 업무자동화, 의사결정지원 — 따로 보면 다 있던 것들입니다. 제조 AI의 진짜 차이는 이 셋이 순환하면서 '우리 공장만의 지능'을 만든다는 데 있습니다.
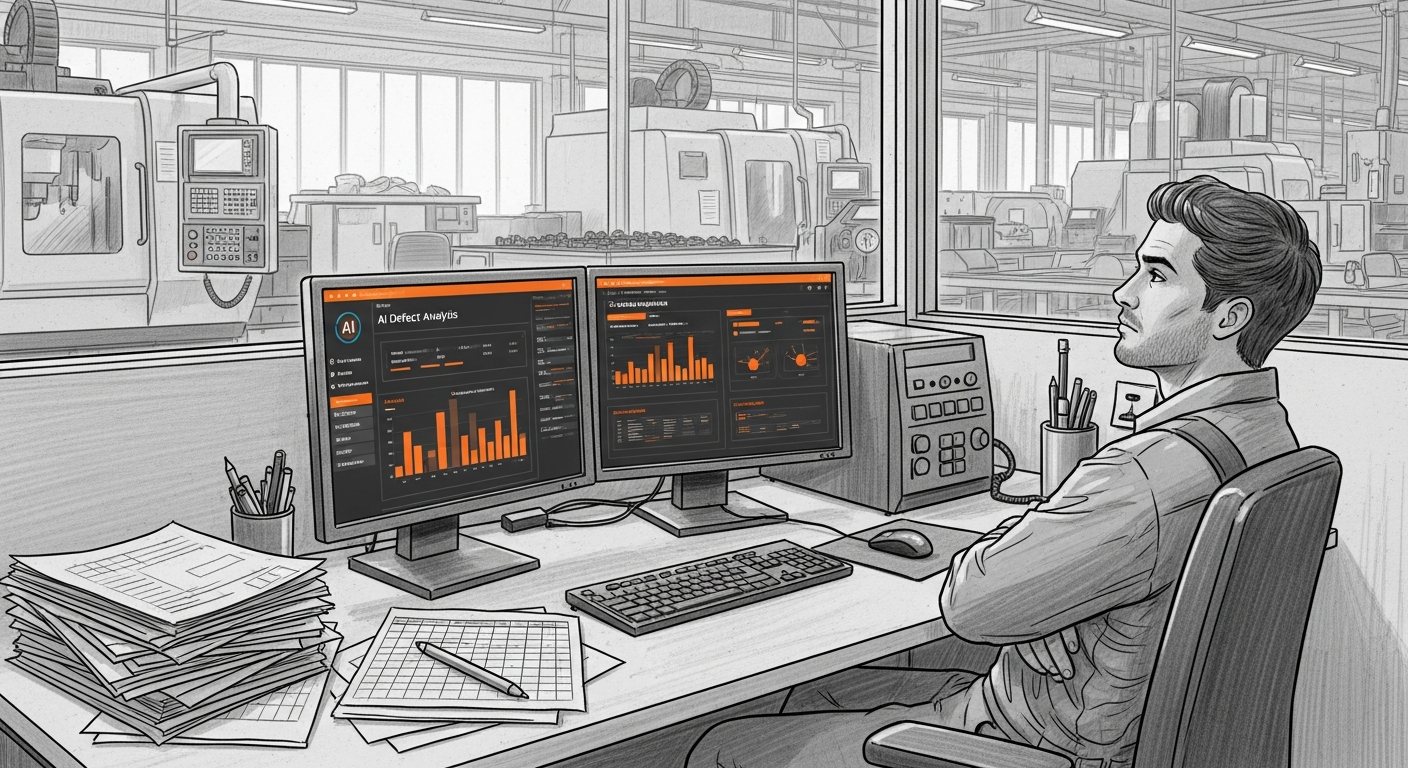
그 30분을 18년 동안 매일 반복했습니다 — 품질팀장이 본 AI Agent
18년차 품질팀장이 매일 아침 30분씩 반복하던 데이터 분석을 AI Agent가 3분 만에 해냈습니다. 챗봇과는 완전히 다른 물건 — 직접 시스템에 접근해서 데이터를 꺼내고 분석하는 AI의 현장 도입기.
Want to apply this in your factory?
MOAI helps manufacturing companies adopt AI tailored to their operations.
Talk to us →