Seven basic tools of quality
{{Short description|Fixed set of visual exercises for troubleshooting issues related to quality}} {{Use British English Oxford spelling|date=October 2018}} {{Use dmy dates|date=October 2018}}
{{Gallery | title = Examples | align = right | perrow = 2 | height = 135 | width = 135 | File:Cause and effect diagram for defect XXX.svg | alt1= | [[Ishikawa diagram|Cause-and-effect diagram]] | File:Check sheet for motor assembly.svg | alt2= | Check sheet | File:C control chart.svg | alt3= | Control chart | File:Histogram of arrivals per minute.svg | alt4= | Histogram | File:Pareto chart of titanium investment casting defects.svg | alt5= | [[Pareto chart]] | File:Scatter diagram for quality characteristic XXX.svg | alt6= | Scatter diagram | File:LampFlowchart.svg | alt7= | Flow chart | File:SimpleRunChart.jpg | alt8= | Run chart }}
The '''seven basic tools of quality''' are a fixed set of visual exercises identified as being most helpful in [[troubleshooting]] issues related to [[quality (business)|quality]].{{sfn|Montgomery|2005|p=148}} They are called ''basic'' because they are suitable for people with little formal training in statistics and because they can be used to solve the vast majority of quality-related issues.{{sfn|Ishikawa|1985|p=198|ps=: "From my past experience as much as ninety percent of all problems within a company can be solved by means of these tools."}}
==Overview== The seven tools are:{{sfn|Tague|2005|p=15}}{{harvnb|Ishikawa|1985|p=198|ps=: "Elementary Statistical Method (the so-called Seven Tools) 1. Pareto chart: The principle of vital few; trivial many 2. Cause and effect diagram (This is not precisely a statistical technique) 3. Stratification 4. Check sheet 5. Histogram. 6. Scatter diagram (analysis of correlation through determination of median; in some instances, use of binomial probability paper) 7. Graph and control chart (Shewhart control chart)".}}{{sfn|Imai|1986|pp=239–240|ps=: "The seven statistical tools used for such analytical problem-solving are: 1. Pareto diagrams ... 2. Cause-and-effect diagrams ... 3. Histograms ... 4. Control charts ... 5. Scatter diagrams ... 6. Graphs ... 7. Checksheets."}} #[[Ishikawa diagram|Cause-and-effect]] diagram (also known as the "fishbone diagram" or Ishikawa diagram) #[[Check sheet]] #[[Control chart]] #[[Histogram]] #[[Pareto chart]] #[[Scatter plot|Scatter diagram]] #[[Stratified sampling|Stratification]] (alternatively, [[flow chart]] or [[run chart]])
The designation arose in [[postwar Japan]], inspired by the [[Benkei#Seven weapons|seven famous weapons]] of [[Benkei]].{{sfn|Ishikawa|1990|p=98|ps=: "They were named the Seven QC Tools after the famous seven weapons of the Japanese [[Kamakura period|Kamakura-era]] warrior-priest Benkei which enabled Benkei to triumph in battle; so too, the Seven QC Tools, if used skillfully, will enable 95% of workplace problems to be solved. In other words, intermediate and advanced statistical tools are needed in about only 5% of cases."}} It was possibly introduced by [[Kaoru Ishikawa]] who in turn was influenced by a series of lectures [[W. Edwards Deming]] had given to Japanese engineers and scientists in 1950.{{cite web |last=Moore |first=Matthew |date=30 November 2007 |title=The Seven Basic Tools of Quality |url=http://www.improvementandinnovation.com/features/article/seven-basic-tools-quality/ |website= Improvementandinnovation.com |location=London |archive-url=https://web.archive.org/web/20121019014101/http://www.improvementandinnovation.com/features/article/seven-basic-tools-quality/ |archive-date=19 October 2012 |access-date=18 May 2013}} At that time, companies that had set about training their workforces in [[quality control|statistical quality control]] found that the complexity of the subject intimidated most of their workers and scaled back training to focus primarily on simpler methods which suffice for most quality-related issues.{{sfn|Ishikawa|1985|p=18|ps=: "It is true that statistical methods are effective, but we overemphasized their importance. As a result, people either feared or disliked quality control as something very difficult. We overeducated people by giving them sophisticated methods where, at that stage, simple methods would have sufficed."}} The [[Project Management Institute]] references the seven basic tools in ''[[A Guide to the Project Management Body of Knowledge]]'' as an example of a set of general tools useful for planning or controlling project quality.{{sfn|Project Management Institute|2013|pp=236–238}}
The seven basic tools stand in contrast to more advanced statistical methods such as [[survey sampling]], [[acceptance sampling]], [[statistical hypothesis testing]], [[design of experiments]], [[multivariate analysis]], and various methods developed in the field of [[operations research]].{{sfn|Ishikawa|1985|pp=198–199|ps=: "I divide statistical methods into the following three categories according to their level of difficulty. 1. Elementary Statistical Method (the so-called Seven Tools) ... 2. Intermediate Statistical Method ... 3. Advanced Statistical Method (using computers concurrently)".}}
==References== ===Footnotes=== {{reflist|22em}}
===Bibliography=== {{refbegin|35em|indent=yes}}
- {{cite book |last1=Duffy |first1=Grace L. |last2=Furterer |first2=Sandra L. |title=The ASQ Certified Quality Improvement Associate Handbook |date=8 June 2020 |publisher=Quality Press |isbn=978-1-951058-13-5 |language=en |chapter=Chapter 9. Improvement Tools}}
- {{cite book |last=Imai |first=Masaaki |author-link=Masaaki Imai |year=1986 |title=Kaizen (Ky'zen): The Key to Japan's Competitive Success |url=https://archive.org/details/kaizenkyzenkey00imai |url-access=registration |edition=1st |location=New York |publisher=Random House |isbn=978-0-394-55186-9 }}
- {{cite book |last=Ishikawa |first=Kaoru |author-link=Kaoru Ishikawa |year=1985 |title=What Is Total Quality Control? The Japanese Way |translator-last=Lu |translator-first=David J. |edition=1st |location=Englewood Cliffs, New Jersey |publisher=Prentice-Hall |isbn=978-0-13-952433-2 |url-access=registration |url=https://archive.org/details/whatistotalquali00ishi }}
- {{cite book |last=Ishikawa |first=Kaoru |author-link=Kaoru Ishikawa |author-mask={{long dash}} |year=1990 |title=Introduction to Quality Control |edition=1st |location=Tokyo |publisher=3A Corp |isbn=978-4-906224-61-6 }}
- {{cite book |last=Montgomery |first=Douglas |year=2005 |title=Introduction to Statistical Quality Control |location=Hoboken, New Jersey |publisher=John Wiley & Sons |isbn=978-0-471-65631-9 }}
- {{cite book |author=Project Management Institute |author-link=Project Management Institute |year=2013 |title=A Guide to the Project Management Body of Knowledge |edition=5th |location=Newtown Square, Pennsylvania |publisher=Project Management Institute |isbn=978-1-935589-67-9 }}
- {{cite book |last=Tague |first=Nancy R. |year=2005 |title=The Quality Toolbox |edition=2nd |location=Milwaukee, Wisconsin |publisher=ASQ Quality Press |isbn=978-1-62198-045-2 |url-access=registration |url=https://archive.org/details/projectmanagersc0000benz }} {{refend}}
{{Quality Tools}} {{Authority control}}
[[Category:Quality control tools]]
From MOAI Insights

디지털 트윈, 당신 공장엔 이미 있다 — 엑셀과 MES 사이 어딘가에
디지털 트윈은 10억짜리 3D 시뮬레이션이 아니다. 지금 쓰고 있는 엑셀에 좋은 질문 하나를 더하는 것 — 두 전문가가 중소 제조기업이 이미 가진 데이터로 예측하는 공장을 만드는 현실적 로드맵을 제시한다.
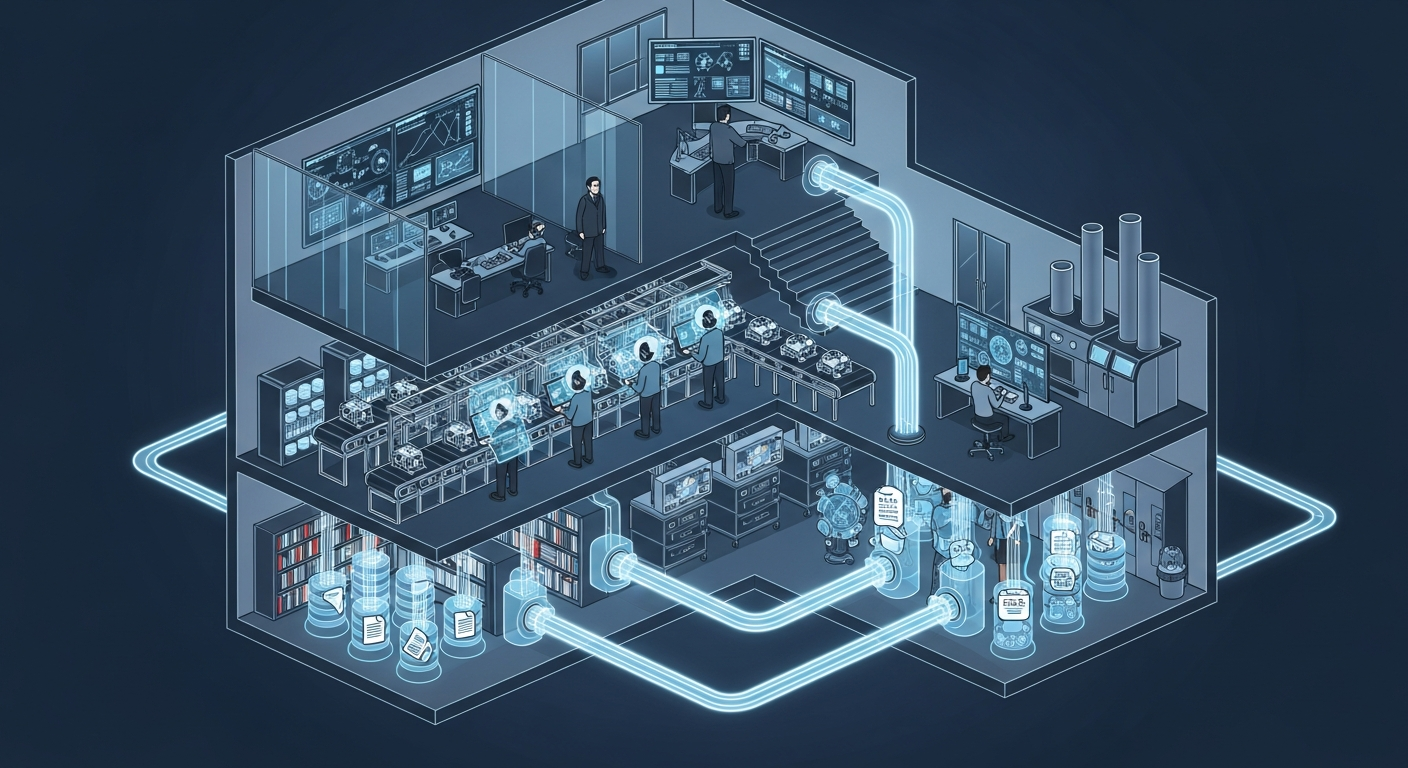
공장의 뇌는 어떻게 생겼는가 — 제조운영 AI 아키텍처 해부
지식관리, 업무자동화, 의사결정지원 — 따로 보면 다 있던 것들입니다. 제조 AI의 진짜 차이는 이 셋이 순환하면서 '우리 공장만의 지능'을 만든다는 데 있습니다.
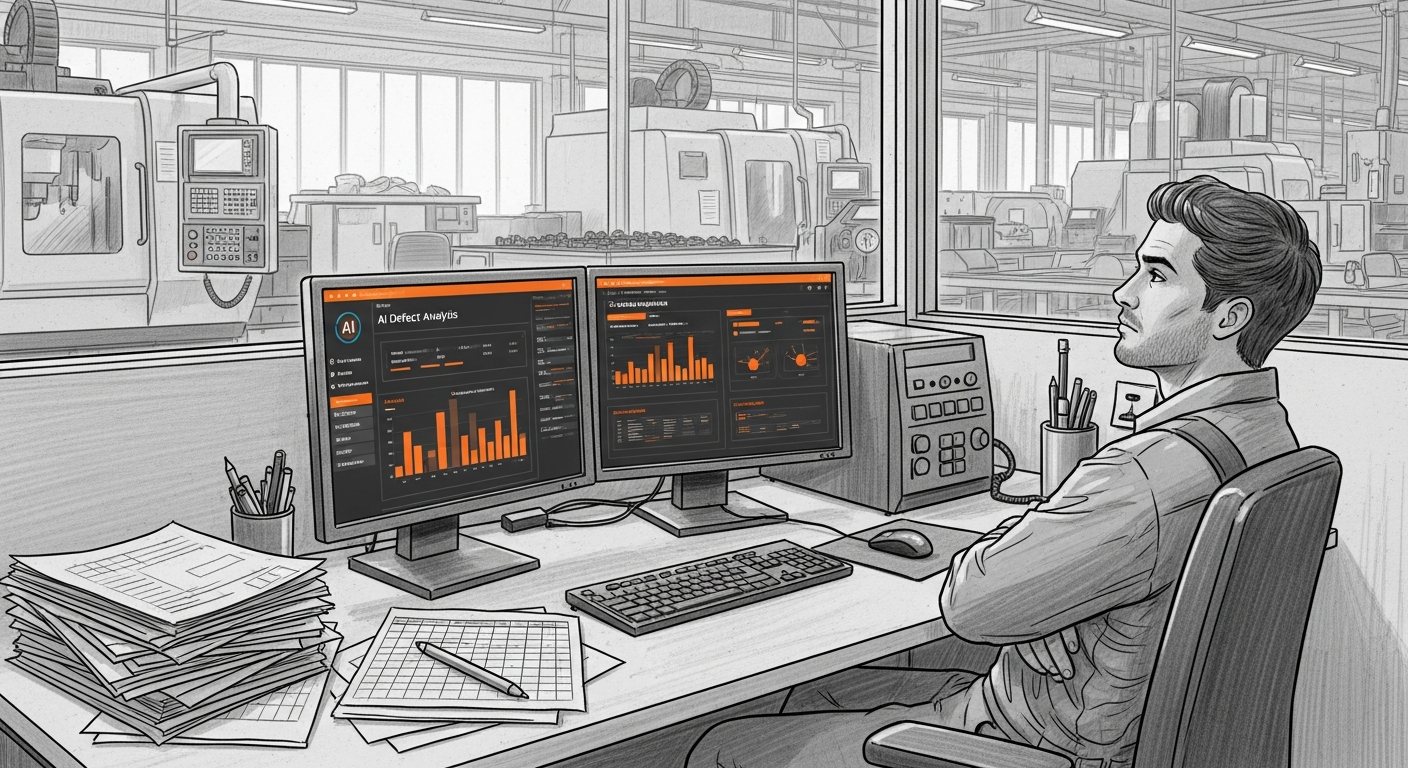
그 30분을 18년 동안 매일 반복했습니다 — 품질팀장이 본 AI Agent
18년차 품질팀장이 매일 아침 30분씩 반복하던 데이터 분석을 AI Agent가 3분 만에 해냈습니다. 챗봇과는 완전히 다른 물건 — 직접 시스템에 접근해서 데이터를 꺼내고 분석하는 AI의 현장 도입기.
Want to apply this in your factory?
MOAI helps manufacturing companies adopt AI tailored to their operations.
Talk to us →